COURSEBOX DASHBOARD REDESIGN
UX/UI Case Study | Research Lead | Information
Design Focus
Client: Coursebox (via Academy Xi)
Role: Research Team Lead
Duration: 4 weeks
Focus: Dashboard UX, role-based design, information architecture
Overview
Coursebox is a white-label LMS platform used in tertiary education and corporate training environments. Our team was tasked with redesigning the reporting dashboard to deliver clearer, more meaningful insights for three key user roles: Super Admins, Course Creators, and Learners.
I led the research team in uncovering pain points, prioritising insights, and shaping a dashboard experience that emphasised clarity, functionality, and role-specific relevance.

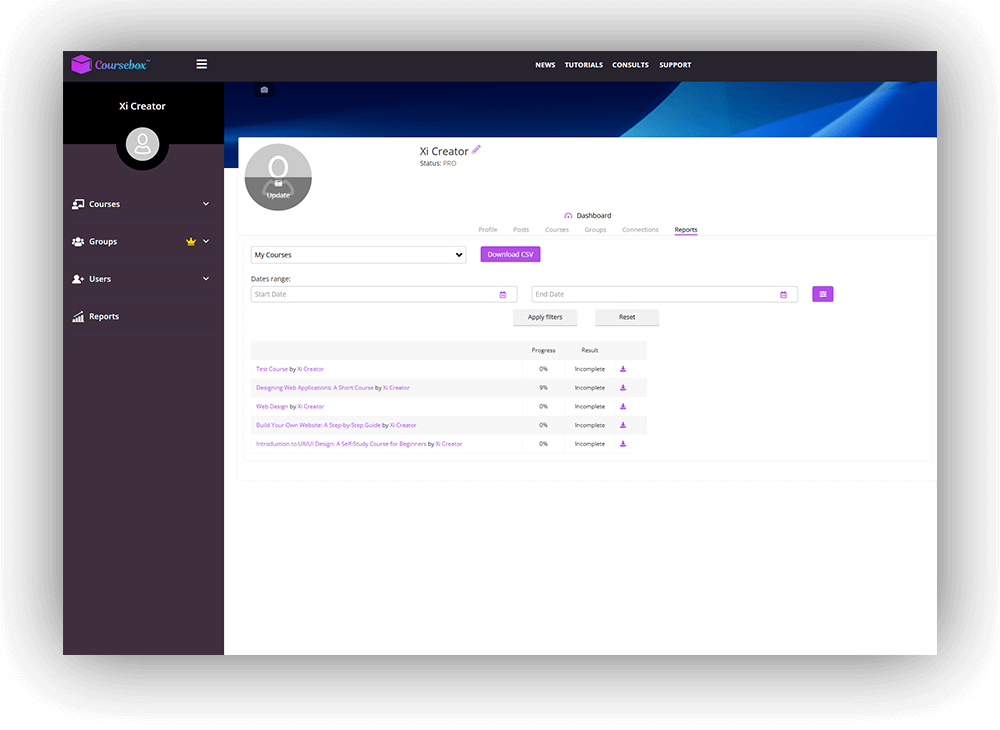
The Problem
“Coursebox’s dashboard lacked real-time insights and meaningful data presentation, making it difficult for users to track progress, manage content, and make informed decisions. The platform provided little useful data at a glance, and its reporting tools lacked refined filtering—resulting in frustration, inefficiency, and a disconnected user experience.”

Objectives
Improve the user interface of the reporting dashboard for all personas
Enhance the UX and depth of insights available in reports and CSVs
Consolidate reporting and analytics features into a streamlined dashboard
My Role & Contributions
Led the UX research team (planning, conducting, and synthesising)
Created interview questions and conducted interviews
Facilitated the creation of refined personas and user journeys
Conducted and synthesised heuristic evaluations and user interviews
Collaborated with design co-leads to ensure alignment of research and UI
Defined key How Might We statements and supported MVP scoping
Focused on information design: content hierarchy, prioritisation, and clarity


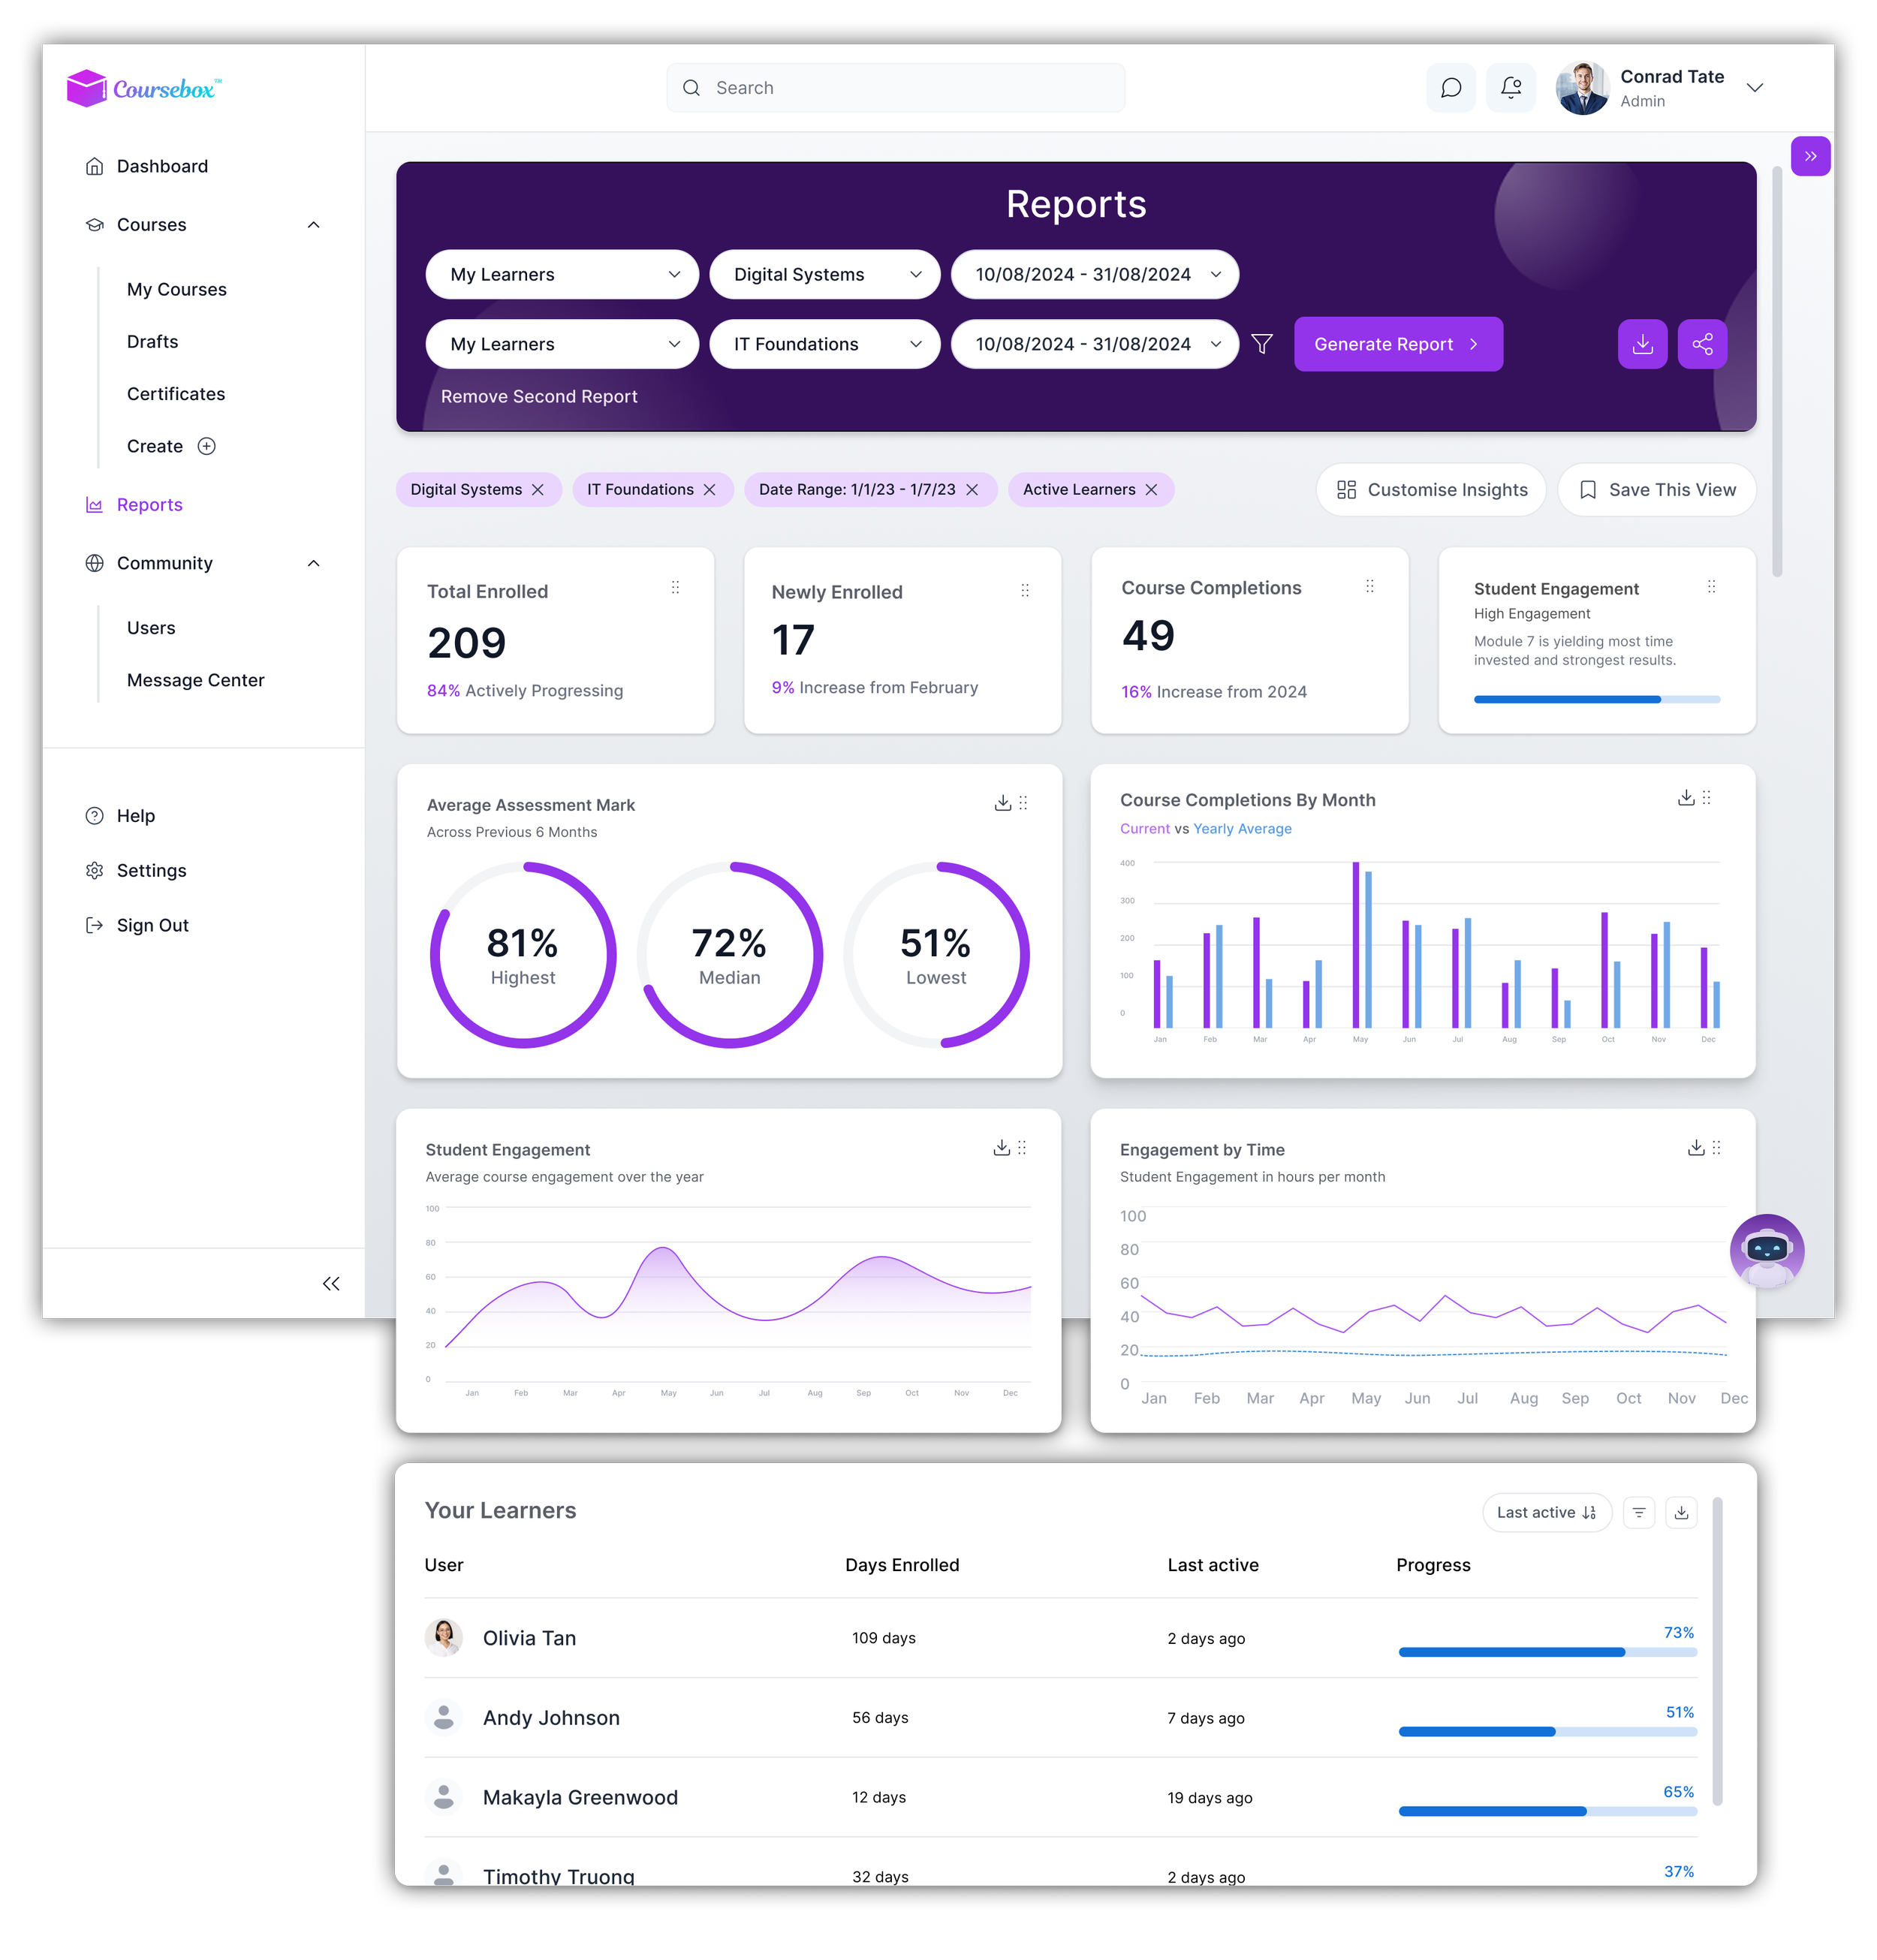
Key Research Insights
1. Need for High-Level + Granular Views
Users want high-level overviews of performance and activity, but also expect the ability to drill down into specific data like completion rates, learner counts, and engagement by module.
2. Lack of Actionable Data in Reports
Reports primarily show raw data (e.g., completion percentages) but lack context or insight. Users found them difficult to interpret and often had to export data for deeper analysis
3. Role Confusion Across the Platform
The system didn’t clearly differentiate between learners, creators, and admins—leading to confusion about permissions, reporting access, and dashboard relevance
4. Unclear Progress Visibility for Learners
Learners couldn’t easily understand what tasks were completed or outstanding. The dashboard lacked visual indicators or reminders, which affected motivation and task tracking.
5. Desire for Dashboard Personalisation
Users expressed interest in being able to customise their dashboard views to match their role and workflow—such as showing priority tasks, favourite courses, or filtered reports.
6. Messaging and Scheduling Tools Fall Short
Participants flagged the need for built-in communication tools or integrations (e.g., Slack, Calendly). Learners and admins both struggled with fragmented messaging and coordination
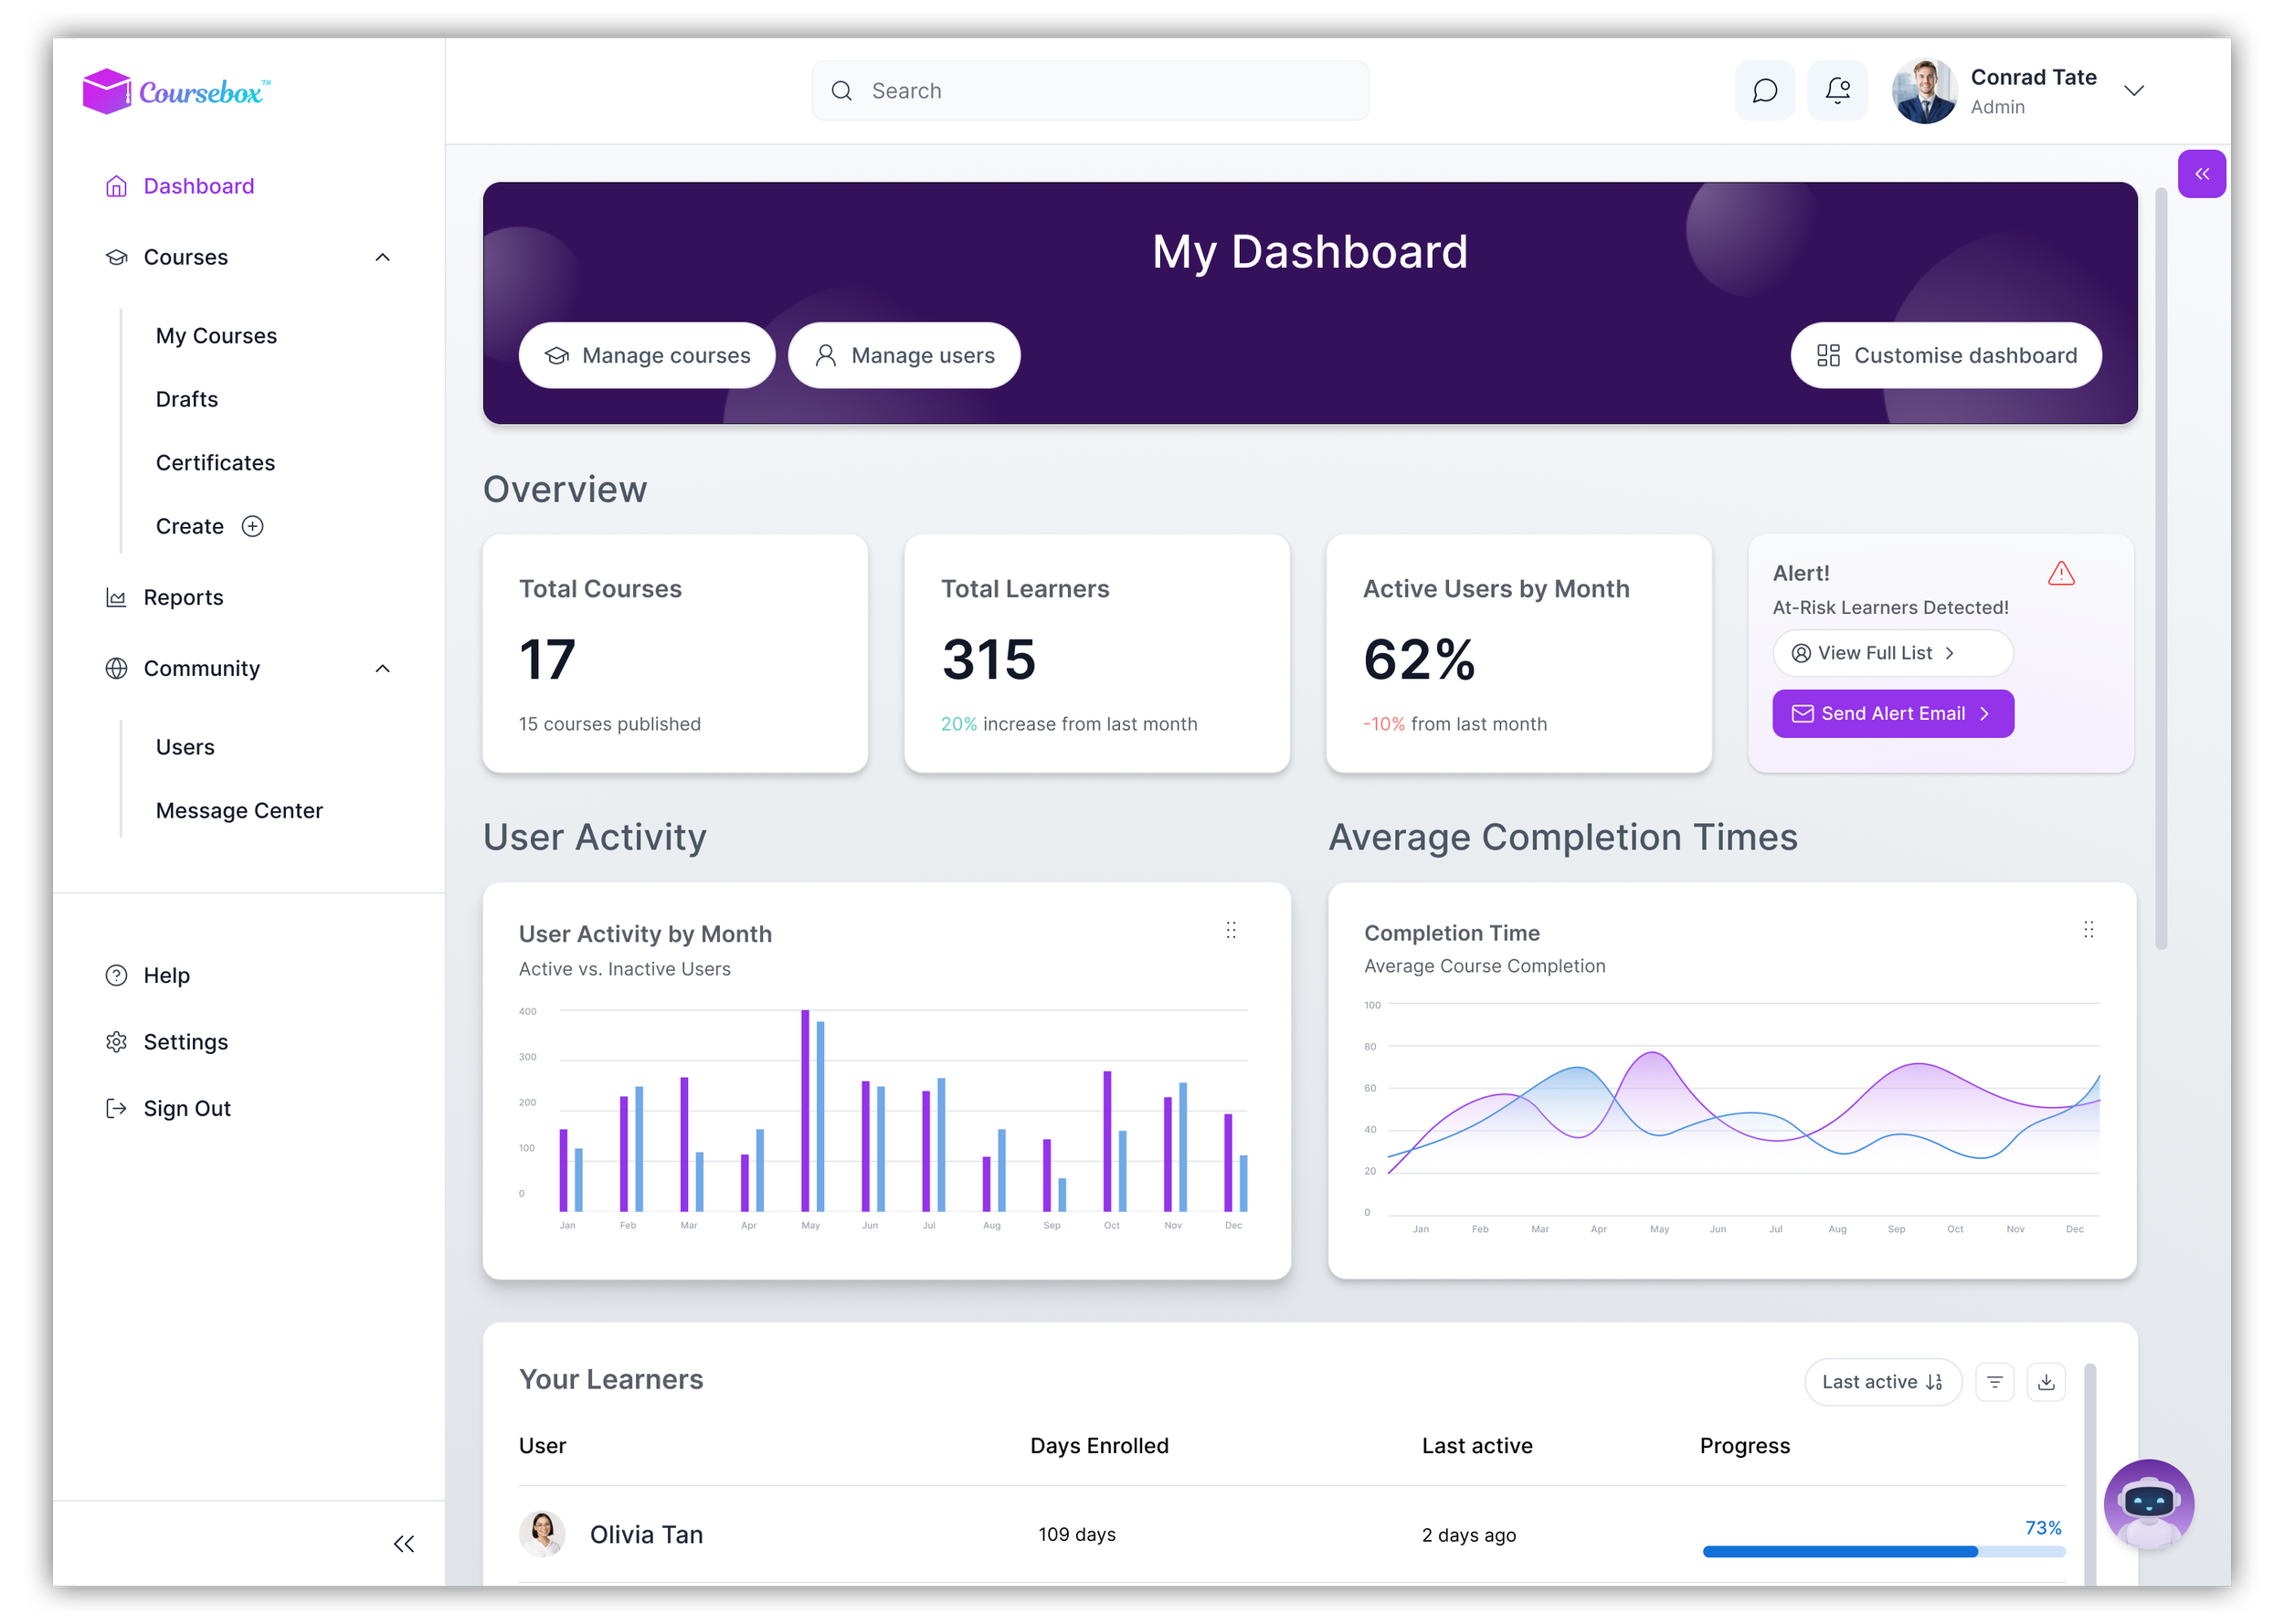
MVP Deliverables
Redesigned dashboard UI for simplified navigation
Student progression and profile views
Integrated data visualisation for reports
Streamlined course and learner management
Revised menu and information hierarchy (concept only)
Reflection
This project gave me the opportunity to lead a collaborative research team while applying my strengths in information design and systems thinking. I learned how to guide discovery, shape priorities, and translate complex data needs into clear, structured experiences. It reinforced the importance of aligning UI design with user context, especially in environments with layered user roles.